Industry 4.0
Digital transformation starts with a useful question.
Your plant already contains equipment, software and people who know how it runs. Industry 4.0 connects those, so information can move between the floor and the people planning, operating and improving the business.

01
Four revolutions, and your plant is still doing all four
- 01SteamMachines stopped depending on muscle and water.
- 02Electricity and the lineWork was divided up and moved along.
- 03The controllerMachines were automated, one at a time, each with its own small computer.
- 04The networkThe machines were already automated. Now they are connected to each other, and to the office.
Each one made the one before it cheaper to run, and none of them replaced it.
02
That list is really two lists
If you have sat through a presentation on this, you were shown a row of nine technologies. It is a good list, and it is two different kinds of thing stacked together — which is why it never quite makes sense.
Where the readings go
- Machines that report
- Equipment that already runs, made to say what it knows, over whatever it already speaks. Nothing is replaced to do it.
- Somewhere that holds it
- A store that keeps every reading, on the plant's own network and off it, so last March is as available as this morning — and it is not a spreadsheet on one engineer's laptop.
- Sense made of it
- Turning a stream of readings into something somebody acts on: what a line drew last week, a limit that has been ridden all shift, a report in the inbox on Monday.
- Who is allowed near it
- Which part of the plant a person may read, who may send a command to a machine, and a record of what was done and by whom.
- The office and the floor agreeing
- The order in the office and the run on the line being the same fact — and the plant next door being readable the same way as this one.
What runs on the floor
- Machines that move on their own
- A robot arm, a guided truck. It does its job and reports what it did — to an address, or to nobody.
- Building a part up instead of cutting it down
- A printer that makes the part rather than a machine that removes metal to find it. It still runs a job, draws power and produces a count.
- Trying it before building it
- Running the line on a computer to see what a change does before anybody makes it. It is worth exactly what the history you feed it is worth.
- A screen held up to the machine
- Instructions and live readings on a headset or a tablet, in front of the person doing the work. What it shows has to come from somewhere.
The trade names, in the order above: the industrial internet of things, the cloud, big data and analytics, cybersecurity, and horizontal and vertical integration — then autonomous robots, additive manufacturing, simulation, and augmented reality.
The list of nine is Boston Consulting Group's, from its 2015 report on Industry 4.0. It is where most of the presentations you have seen get it.
Read the first five again. Machines that report, somewhere to hold it, sense made of it, who is allowed near it, and the office and the floor agreeing. Those are not five purchases. They are five faces of one question: where does everything this plant knows go, and what is it called when it gets there.
That question is the whole of what we build. Answer it once and the first five stop being a shopping list and start being one piece of work.
The last four are yours. We do not sell a robot, a printer, a simulator or a headset, and nothing here asks you to buy one. But every one of them either produces readings or needs them — so every one of them can use the same address as the rest of the plant, and a plant that already has the address is the one where they are worth buying.
03
The holy grail, where every rung costs money
For thirty years a factory was wired as a stack — the holy grail. A sensor reports to the small computer that runs the machine. That reports to the screen in the control room. That reports to whatever tracks what was produced, which reports to whatever runs the business. Each level talks only to the one above it.
Every one of those links is its own project — a specification, a consultant, an invoice — and every one breaks when either end is upgraded. Connect ten systems to each other and there are forty-five links to build, pay for and repair.
Wired to each other10 links
One join each, to the UNS5 links
Which is why so many plants have a control-room screen nobody trusts, a spreadsheet everybody actually uses, and an office system that finds out what happened three days later.
A UNS, instead of forty-five wires
Everything publishes what it knows once, into one unified namespace — a UNS — in a form everything else can read. Anything that needs a number takes it from there.
A new system connects once and immediately has everything already in it. Forty-five links become ten, and the eleventh system costs one connection rather than ten more.
Nothing is thrown away to do this. Your controllers stay. Your control room stays. Your office system stays. They stop being wired to each other.
04
Everything in it is named after your plant
The UNS only works if everything in it is named the same way, so the naming follows the shape you already use: the site, the areas inside it, the lines inside those, and the machines on those lines.
enterprise / site / area / line / cell / reading
Read left to right, that is a sentence — this machine, on that line, in that area, at that site. Every chart, alert, report and export uses the same address, so renaming a line renames it everywhere, and adding a machine does not mean rebuilding a report.
It holds what is true right now. Not a copy of it, and not last night's export.
That shape is ISA-95. The words are worth precisely as much as the habit behind them: name things after the plant, once, and stop renaming them.
05
The applications are the easy part
Production
What each line ran, how fast, and why it stopped — by machine and by shift, rather than as a monthly figure nobody can take apart.
Materials
What the store holds, what moved, and what a job actually used against what it was supposed to use.
Orders and costing
The order the plant is working against, and what it really cost to fulfil.
Energy
What each area, line and machine used, and on which source: grid, generator, solar, battery.
None of these needs a new machine. All of them need the address.
You will have heard these quoted in initials alongside the list of nine. Production and materials together are what engineers call a manufacturing execution system, or MES; orders and costing belong to the business system, the ERP; the energy one is an EMS. Three sets of initials for four ordinary jobs, all of them reading the same addresses.
06
The questions that need two systems at once
A dashboard tells you what one system knows. A shared address lets you ask a question that crosses two of them.
- 01What did one good part cost to make — machine time, material and electricity together?
- 02Which shift is cheaper, once you count the generator hours each one burned?
- 03What did that stoppage cost — the idle machine, the wasted material, and the order it delayed?
No single system can answer any of these, which is why nobody has been answering them.
The two halves
Connect the physical process to the business process.
Controllers and machine systems know what the equipment is doing. Planning and business tools know what should be made, delivered or recorded. A UNS connects those views without every application needing its own private link to every other one.
What runs the plant
Controllers, drives, machine interfaces and the systems supervising them. They know state, counts, rates and conditions as they happen, and they are built to keep running whatever else does not.
What runs the business
Orders, products, plans, costs and records. They know what was promised and what was invoiced, and they work in hours and days rather than milliseconds.
Connecting them does not mean flattening the control network, and it does not mean routing machine control through anything outside the plant. The existing networks and the responsibilities on them stay where they are. What moves is information, in an agreed direction, under rules written down before anything is installed.
How it is built
Four principles, in practical language.
Decide at the edge
Interpret equipment data close to where it is produced, before publishing it, so the network carries meaning rather than noise.
Publish what changed
Send the useful changes rather than everything, with the state and whether a device is still alive both handled explicitly. Equipment may still be polled at the edge - that is how a device is read, not how the information travels.
Open and extensible
Defined interfaces and agreed data contracts, so a system that arrives later can join the model without anybody rewriting what is already there.
Keep it light
Messages carry what their consumers need and no more. A model nobody can afford to run is a diagram.
Our founders' learning on shared-namespace architecture draws on Walker Reynolds' teaching, and on the ISA-95 integration standard. Neither implies endorsement, membership or an accreditation.
How we work with you
Assess. Demonstrate. Prove. Expand. Govern.
- 01AssessA map of the systems and the people using them, and the use case worth testing first.
- 02DemonstrateA working demonstration, on your own data.
- 03ProveOne agreed workflow, with a baseline and a result somebody signs off.
- 04ExpandA scope for the next assets and applications on the same foundation.
- 05GovernDocumented data ownership, access and change process, and the team handed the keys.
Commissioning and handover are part of the scope rather than something that happens after it. We will not promise a complete transformation in a fixed number of days before anybody has walked the site - the assessment is what makes a timeline mean anything.
Training and demonstrations
Learn by following the data.
We are developing guided demonstrations and workshops that connect equipment, shared data and a practical decision. A learner should finish able to acquire a signal, map an asset, build a view, and explain who can act on the result.
Students and early-career engineers
Introductory demonstrations and guided labs.
Industrial teams
Workshops built on examples from a site like theirs.
Decision makers
Use-case discussions, and scoping a first pilot.
Sources, evidence and further reading
The energy research this page used to open with is below, whole: the method, the window, the instruments, every figure with the document it came from, and a section on what it does not establish. It is behind a disclosure rather than in the reading flow because it is evidence - and evidence is for the reader who has decided to check.
How to tell our numbers from everyone else's
Three of the figures on this page we measured on our own deployment. The rest are published by EDL, the Ministry of Energy and Water, the Ministry of Industry, LCEC or the World Bank, or computed here from those. Each figure says which it is, in words and with a marker, in the disclosure beneath it. Open one and you get the document, the date the figure describes, and whatever is wrong with it.
07
Three traps that make Lebanese numbers lie
They are why the same statistic gets quoted three different ways. All three are avoidable, and every figure on this page has been through them.
- Currency
- The lira went from a pegged 1,507.5 to the dollar, until October 2019, to an official 89,500 from January 2024. A money figure without a currency, a year and a rate is meaningless. Every conversion here uses 89,500 and says so.
- The tariff reset
- EDL's tariff was frozen from 1994 until November 2022. The reform re-based it in US dollars and abolished the discounted industrial class outright. No electricity cost from before that reform describes today's economics — and several stale ones still sit on Lebanese government websites.
- Vintage
- The most recent authoritative industrial survey is 2017. The licensed-factory register is 2022. National solar statistics describe 2023. Anything presented as the Lebanese industrial market today is stale unless it says otherwise.
08
There are about five to six thousand factories, not eighteen thousand
And perhaps four hundred to nine hundred at a size where metering the whole site is a serious proposition.
Figures in this section
5,000factoriesLicensed manufacturing universe, lower boundPublished source
Published source
Source: Ministry of Industry, Permanent Industrial Statistical System (2017) and published 2022 licence lists · As of 31 December 2022
The 18,000+ figure that circulates is a union of overlapping registries and is disputed on the record by the Association of Lebanese Industrialists.
6,000factoriesLicensed manufacturing universe, upper boundPublished source
Published source
Source: Ministry of Industry, published 2022 licence lists, row-counted: 5,956 · As of 31 December 2022
400sitesLarge and upper-middle industrial sites, lower boundComputed here
Computed here
Source: Ministry of Industry 2017 sample (n=1,520) scaled to the 2022 licence lists; corroborated by LCEC's independent '500 large industries' · As of 31 December 2022
900sitesLarge and upper-middle industrial sites, upper boundComputed here
Computed here
Source: Ministry of Industry 2017 sample (n=1,520) scaled to the 2022 licence lists · As of 31 December 2022
Three counts circulate and they disagree by a factor of three. The Ministry of Industry's own 2017 statistical system records 5,173 licensed factories. Its published 2022 licence lists, downloaded and row-counted, hold 5,956 — of which 5,752 are manufacturing, with no duplicate factory identifiers across the twenty-five files.
The 18,500 that gets quoted is a union of overlapping registries compiled by a private publisher. The president of the Association of Lebanese Industrialists disputes it on the record: it is “way too high, unless it includes all small craftsmen, whose activity does not meet the criteria for obtaining an industrial license.” The same reporting notes the Ministry's register double-counts creation licences and operation licences for the same firm.
For the top of the market, two unrelated methods land in the same few hundred. Scaling the Ministry's randomly drawn 1,520-factory sample gives roughly 364 to 419 factories above ninety-nine employees. LCEC's own working segmentation for its national demand model was “500 large industries and 3,500 medium ones.”
Food is the largest single sector at 28.4% of licensed factories, in a country where refrigeration and process cooling is the second-largest industrial electrical load after motors.
What is wrong with this
What this does not tell you
How many of the 5,956 still operate. No closure or de-licensing statistic is published by the Ministry, the industrialists' association or the census administration, and there is no count anywhere of what the 2024 war destroyed. A 2022 licence register, in a country that fought a war in 2024, is a list of licences and not a list of factories.
09
Two official prices, both 2026, both already in dollars
Industry pays 27 US cents to EDL on its entire consumption. The regulated neighbourhood generator rate is nearly double that.
Figures in this section
$0.27What industry pays EdL, per kWhPublished source
Published source
Source: Electricite du Liban, notice 429, 6 February 2024, reconfirmed unchanged by MEW, 23 July 2026 · As of 23 July 2026
Flat on the entire consumption. Industry gets no subsidised first block; households do.
41,973LBP/kWhRegulated neighbourhood generator ratePublished source
Published source
Source: Ministry of Energy and Water, generator-pricing widget, June 2026 (latest published) · As of 30 June 2026
$0.469Regulated generator rate, in dollarsComputed here
Computed here
Source: 41,973 LBP/kWh (MEW, June 2026) divided by 89,500 LBP/USD (Banque du Liban official rate) · As of 30 June 2026
The neighbourhood subscription cap — an upper bound. A factory running its own genset pays no operator margin.
1.74xWhat generator power costs against grid powerComputed here
Computed here
Source: $0.469 / $0.27 = 1.737. Both official Lebanese figures, same year, same currency · As of 30 June 2026
There is no cheap first block for a factory. Low-voltage general supply gets its first 100 kWh at 10 US cents; industrial, agricultural, touristic and places-of-worship tariffs — the formerly discounted classes — now pay 27 US cents on everything. A household's first hundred kilowatt-hours are cheaper than a factory's first one.
The regulated generator rate is published monthly by the Ministry of Energy and Water and applies to neighbourhood subscriptions. Above 700 metres and in rural areas it is 10% higher again. It is a ceiling for a factory rather than a price it pays: a site running its own machine pays no operator margin and carries no neighbourhood distribution loss, but it carries the capital instead.
The structural point that gets missed: the tariff is denominated in dollars and indexed to international oil prices, so devaluation no longer erodes it. That is the substantive change from 1994. The pre-reform block of 35 LBP/kWh was 2.32 US cents at the peg and 0.039 US cents at 89,500 — EDL's own reform document prints that second number.
- Private substation, medium voltage
- 27 US cents per kWh, plus a capacity charge of US$0.60 per kVA. It was $0.70, then $1.05, before settling.
- Low-voltage capacity charge
- 25 US cents per ampere per month, since February 2024. A 21-cent figure appears in November 2022 press coverage and is not an error — it belonged to a different regime. Any capacity charge needs its date attached.
- Reactive power
- 10 US cents per kVARh, on kVARh above 75% of actual consumption. This one is measurable behind the meter and most sites do not know their number.
- Concession areas and tax
- Zahle and Jbeil are 21 US cents. VAT at 11% and stamp duty are added in lira and are normally recoverable by a registered industrial.
10
The grid was on for about six and a quarter hours a day
That is EDL's own 2025 figure. The other roughly eighteen hours come from somewhere, and somebody pays for them.
Figures in this section
6.24hours/dayAverage daily grid supply, 2025Published source
Published source
Source: Electricite du Liban, Cost Recovery Plan Addendum, December 2025, Fig. 2 · As of 31 December 2025
Official but modelled — an input and output of EDL's financial model, not a metered national statistic. The invoiced figure in the same document is 3.80 hours.
40.17%EdL total system losses, 2025Published source
Published source
Source: Electricite du Liban, Cost Recovery Plan Addendum, December 2025 · As of 31 December 2025
Theft and technical loss on the utility's own network. Nothing behind a factory's meter recovers any of it.

The same document reports 3.80 hours a day as the supply actually invoiced to consumers, and projects 8.16, 8.33 and 9.72 hours for 2026, 2027 and 2028. Those three are a projection inside a financial model, not a measurement, and they should never be quoted as though they were data.
Nor, strictly, should the 6.24. It is official but modelled — an input and an output of EDL's cost recovery plan rather than a metered national statistic. There is no published measured series and no regional or governorate breakdown at all: EDL runs a per-substation query tool and publishes nothing static. If your own hours differ from 6.24, your own hours are the better number.
One policy buried in the same plan is worth knowing before you install solar: feeders with fewer than 10% PV connections relative to their customer count receive an additional two hours of supply per day. Grid hours are allocated inversely to solar adoption.
11
Private generators out-produce the national utility
In 2023 diesel made 51% of Lebanon's electricity and EDL made 28%. That is the fact that reframes what a Lebanese factory is actually buying.
Figures in this section
51%Of national electricity from private generators, 2023Published source
Published source
Source: LCEC, The 2023 Solar PV Status Report for Lebanon, April 2025, p.13 · As of 31 December 2023
The same institution's NREAP 2025-2030 gives a different EdL split for the same years; the totals agree exactly, only the split diverges.
28%Of national electricity from EdL, 2023Published source
Published source
Source: LCEC, The 2023 Solar PV Status Report for Lebanon, April 2025, p.13 · As of 31 December 2023
15%Of national electricity from solar PV, 2023Published source
Published source
Source: LCEC, The 2023 Solar PV Status Report for Lebanon, April 2025, p.13 · As of 31 December 2023
| Source | 2021 | 2022 | 2023 |
|---|---|---|---|
| EDL conventional | 6.9 (48.6%) | 2.1 (21.0%) | 2.8 (28%) |
| Private generators | 6.4 (45.2%) | 6.0 (59.4%) | 5.2 (51%) |
| Solar PV | 0.3 (2.2%) | 1.3 (12.4%) | 1.6 (15%) |
| Hydro | 0.6 (4.1%) | 0.7 (7.1%) | 0.5 (5%) |
| Total | 14.28 | 10.16 | 10.13 |
LCEC, The 2023 Solar PV Status Report for Lebanon, April 2025, p.13. Published source.
What is wrong with this
Two official series disagree here
The same institution's National Renewable Energy Action Plan 2025–2030 gives EDL's supply as 7 to 25% above these figures for the same years. The totals agree exactly — 14,283, 10,159 and 10,134 GWh — and only the EDL split diverges. We use the tabulated LCEC series and say plainly that the other exists.
12
Blended across a day, a kilowatt-hour costs about forty-two cents
Roughly double the headline tariff, and four assumptions are doing the work. All four belong on the page.
Figures in this section
$0.42Blended cost across a day of grid and generatorComputed here
Computed here
Source: (6.24/24 x $0.27) + (17.76/24 x $0.469) = $0.417, using EDL's own 2025 supply hours · As of 30 June 2026
Assumes a flat 24-hour load. No Lebanese industrial load-shape data exists, so a single-shift plant will differ.
$0.41Diesel, fuel onlyComputed here
Computed here
Source: 0.3541 L/kWh (implied by MEW's own tariff formula) x $1.152/L gasoil, June 2026 · As of 30 June 2026
Fuel alone, before capital, maintenance and operator margin. About $0.387/kWh once the ~5% neighbourhood network loss a factory does not incur is removed.
2.824kWh/litreDelivered kWh per litre of gasoil, MEW's implied figureComputed here
Computed here
Source: 1 / 0.3541 L/kWh, the fuel intensity implied by MEW's own generator tariff formula · As of 30 June 2026
Contested. The World Bank's 2018 fleet average is 3.2 kWh/litre — a 7-13% gap on the single most important constant in any diesel cost model, and nobody has measured it.
At EDL's own 6.24 hours a day, with a flat load and no solar: (6.24 ÷ 24 × $0.27) + (17.76 ÷ 24 × $0.469) = $0.417 per kWh. On the invoiced basis of 3.80 hours from the same document, $0.437.
The Ministry's regulated generator tariff turns out to be a formula, and it can be recovered from its own published pairs of fuel price and rate: LBP/kWh = 0.3541 × gasoil LBP/litre + 5,473. Tested against two months it was not fitted on, it predicts within 0.02%. That means 0.354 litres of gasoil per delivered kilowatt-hour and a non-fuel allowance of 5,473 LBP/kWh, about 6.1 US cents, covering maintenance, capital recovery and the operator's margin. Fuel is about 87% of the cost. It is a fuel-price passthrough, not a business.
We use that formula, with the fuel price as the one thing you change, because it is the only published Lebanese arithmetic that reproduces official numbers to two decimal places.
- It assumes a flat 24-hour load
- Untested. There is no Lebanese industrial load-shape data of any kind — no shift patterns, no peak-to-average, no seasonality. A single-shift daytime plant whose EDL window falls outside production hours has a different blend and a different opportunity.
- The generator leg is the wrong instrument
- $0.469 is the neighbourhood subscription cap. A factory usually runs its own machine: no operator margin, no neighbourhood network loss, its own capital. The floor, from the Ministry's own implied fuel intensity, is about $0.408 per kWh in fuel alone, or roughly $0.387 once the network loss a factory does not incur is removed. What a Lebanese factory really pays to self-generate is unmeasured anywhere in the public record.
- The generator price is war-elevated
- Gasoil rose about 42% between February and March 2026, which the Ministry attributes to the regional war. If the war ends and diesel halves, the headline halves with it.
- How many kWh a litre makes is contested
- The Ministry's regulatory formula implies 2.824 delivered kilowatt-hours per litre. The World Bank's 2018 fleet average is 3.2. That is a 7 to 13% gap on the single most important physical constant in any diesel cost model, and nobody has measured it on a Lebanese factory. We print both figures rather than picking one and burying the choice inside a number.
13
Industry is already the biggest buyer of new solar
29% of capacity installed in 2023 — the largest share of any sector. Industry is not waiting to be convinced that energy is worth spending money on.
Figures in this section
29%Industry's share of new solar capacity installed, 2023Published source
Published source
Source: LCEC, The 2023 Solar PV Status Report for Lebanon, April 2025 · As of 31 December 2023
The largest share of any sector. Industry is already spending on its own generation.
6.5cSelf-consumed solar, without storageComputed here
Computed here
Source: LCEC 2023 capex $738/kWp, 1,460 kWh/kWp/yr, 25-year life, 10% real discount rate · As of 31 December 2023
About 80% of recent Lebanese capacity was installed with storage, so this is the minority configuration.
12cSelf-consumed solar, with storageComputed here
Computed here
Source: LCEC 2023 capex $1,384/kWp, same yield, life and discount rate · As of 31 December 2023
A floor: it excludes battery replacement around year 10 and round-trip losses.
Average turnkey cost in 2023 was $1,003 per kWp across all systems: $738 without batteries and $1,384 with. Measured yields by climatic zone run 1,453 to 1,509 kWh per kWp per year. Cumulative installed capacity reached about 1,081 MWp by the end of 2023, of which 989 MW went in during 2021, 2022 and 2023 alone.
No Lebanese levelised cost study exists. LCEC, the Ministry, the World Bank, UNDP and the Arab Reform Initiative all publish capex and yields; none publishes an LCOE. The 6.5 to 12 cent range on this page is computed here from LCEC's own 2023 capex over a 25-year life at a 10% real discount rate, and the arithmetic is in the source note under each figure.
In 2021 and 2022 the boom was residential. By 2023 it had moved to industry. That is a market-timing signal, not a sales argument: these are sites that have already decided to spend on their own generation.
What is wrong with this
Two disclosures travel with the solar numbers
About 80% of recent Lebanese capacity was installed with storage, so quoting the no-storage figure alone selects the minority configuration and roughly halves the answer. And the with-storage figure is a floor: it excludes battery replacement around year ten and round-trip losses. Also note that LCEC computed its yield averages after excluding readings below 1,000 and above 2,000 kWh per kWp, a truncation that biases the mean upward; the 1,460 used here is the conservative zone value.
14
The dearest kilowatt-hour on a Lebanese site costs about seven times the cheapest
That spread, re-priced monthly by a fuel market nobody controls, is the whole reason to know which source is carrying which load.
Seven times is the defensible maximum, and only against a derived self-consumed solar cost. With storage it narrows to about four times. What that difference is worth to any particular factory depends on its load, its hours and what it could actually shift — and nobody has measured that, here or anywhere else in Lebanon.
| Source | Cost per kWh | What it depends on |
|---|---|---|
| Self-consumed solar | 6.5–12¢ | Storage, and whether the load happens while the sun is up |
| EDL grid | 27¢ | Being one of the roughly six hours a day it is on |
| Diesel, fuel only, own genset | ~39¢ | Your own machine and fuel: no operator margin, and none of the ~5% neighbourhood network loss |
| Diesel, regulated rate | 47¢ | A neighbourhood subscription — the ceiling, not the floor |
| Blended across a day | ~42¢ | EDL's own supply hours and a flat load |
Every row is sourced in the sections above: EDL notice 429, the Ministry's June 2026 generator rate, and the derived solar and fuel-only figures with their assumptions.
What is wrong with this
The claim we will not make
A thirteen-times spread circulates. It is not derivable from any sourced pairing: it sets the generator rate against the 5.7 to 6.2 cent utility-scale power purchase price, which a factory cannot buy at, for projects the national plan says are stalled for lack of financing.
15
Measured by us
One site, thirty days, three quarters with no address
This is the only part of this page we measured ourselves. It is one incomer over one window, and we do not present it as a national statistic.
Figures in this section
10,531kWhThrough the main incomer, 30 daysMeasured by us
Measured by us
Source: Sol4.o deployment, one site, 30-day window · As of 31 July 2026
One incomer over one 30-day window, not the whole site's annual consumption.
2,740kWhTraceable to a named sub-circuitMeasured by us
Measured by us
Source: Sol4.o deployment, one site, 30-day window · As of 31 July 2026
7,791kWhWith no addressMeasured by us
Measured by us
Source: Sol4.o deployment, one site, 30-day window · As of 31 July 2026
Derived by subtraction from the two metered figures above.
74%Of the incomer that reached no named circuitMeasured by us
Measured by us
Source: Sol4.o deployment, one site, 30-day window · As of 31 July 2026
Assumes the three pulse meters are 400 impulses per kWh, which is their nameplate. At 1,000 impulses per kWh the untraced share would be nearer 81%.
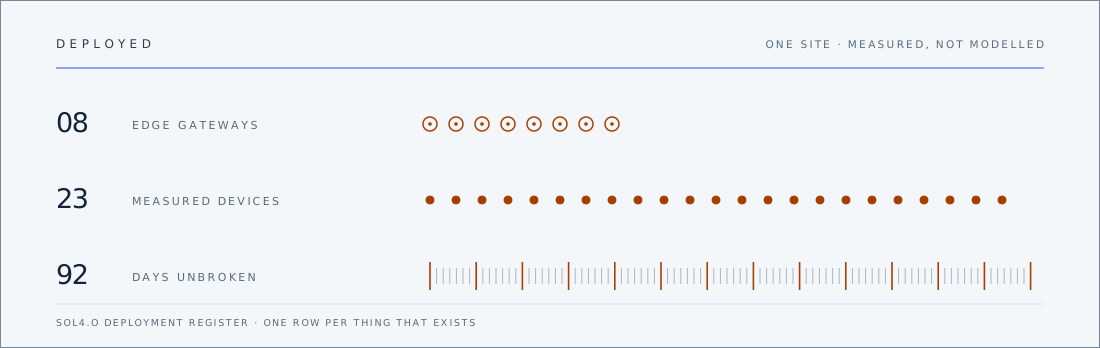
8gatewaysEdge gateways in the fieldMeasured by us
Measured by us
Source: Sol4.o deployment register · As of 7 September 2026
23devicesMetered devicesMeasured by us
Measured by us
Source: Sol4.o deployment register, one site · As of 7 September 2026
Breaker meters, power meters, pulse meters and PLCs, counted as devices that report a measurement.
92daysOne site streaming without a breakMeasured by us
Measured by us
Source: Sol4.o deployment, continuous telemetry · As of 7 September 2026
Fig. 2
Through the main incomer, 30 days
2,740kWhaddressed26%
7,791kWhno address74%
Measured by us
Source: Sol4.o deployment, one site, 30-day window · As of 31 July 2026
Assumes the three pulse meters are 400 impulses per kWh, which is their nameplate. At 1,000 impulses per kWh the untraced share would be nearer 81%.
Main LV board · single line
12 ways · 3 metered · drawn, not surveyed
Over 30 days, 10,531 kWh entered through the main incomer. 2,740 kWh reached a named sub-circuit. 7,791 kWh — 74% of it — had no address.
The board above is drawn, not surveyed. Twelve ways with three meters on them stand for a switchboard of that shape; no customer's board is reproduced here, and no way carries a load name. The kWh are measured, on our own deployment.
Qualifier pending
Sector, connected load and month are not published here yet. Until they are, read 10,531 kWh as one incomer over one 30-day window — not a whole site's consumption, and not a year.
What each source costs, and who published the price:
Published source
Source: Electricite du Liban, notice 429, 6 February 2024, reconfirmed unchanged by MEW, 23 July 2026 · As of 23 July 2026
Flat on the entire consumption. Industry gets no subsidised first block; households do.
Computed here
Source: 41,973 LBP/kWh (MEW, June 2026) divided by 89,500 LBP/USD (Banque du Liban official rate) · As of 30 June 2026
The neighbourhood subscription cap — an upper bound. A factory running its own genset pays no operator margin.
Computed here
Source: LCEC 2023 capex $738/kWp, 1,460 kWh/kWp/yr, 25-year life, 10% real discount rate · As of 31 December 2023
About 80% of recent Lebanese capacity was installed with storage, so this is the minority configuration.
Computed here
Source: LCEC 2023 capex $1,384/kWp, same yield, life and discount rate · As of 31 December 2023
A floor: it excludes battery replacement around year 10 and round-trip losses.
 DRAWN
DRAWN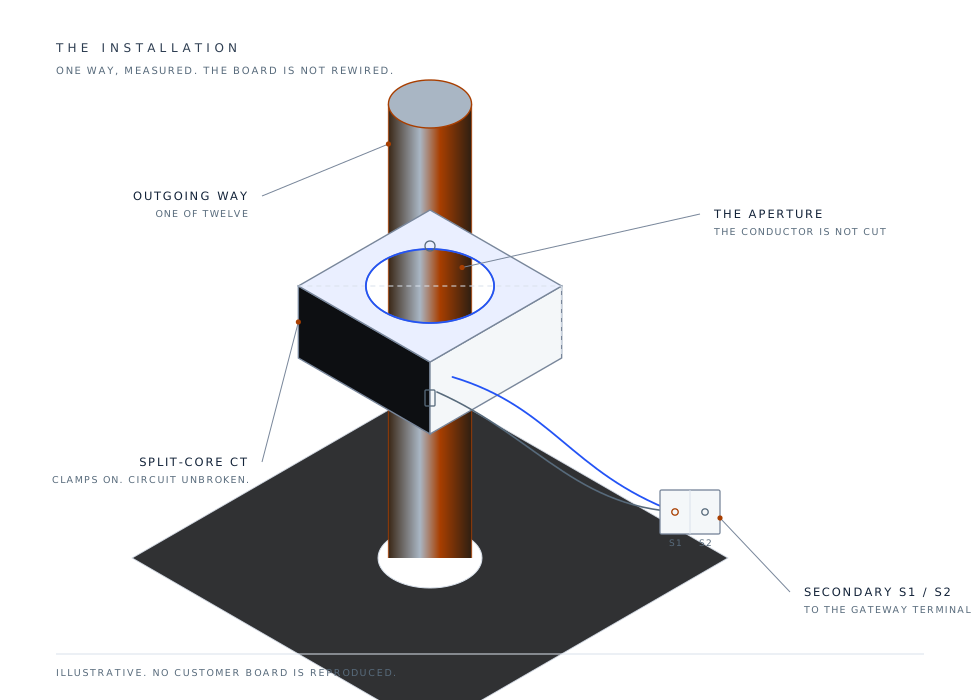 DRAWN
DRAWNOver thirty days, 10,531 kWh passed through the main incomer of one site we metered. 2,740 kWh of that reached a named sub-circuit. The remaining 7,791 kWh was consumed by something real, and no meter on that site could say what. That is the finding. Not loss, and not theft. Unaddressed: consumed by something real that no meter is watching.
The deployment behind it is eight edge gateways and twenty-three metered devices: eleven breaker meters, six power meters, three pulse meters and two programmable controllers. One site has streamed for ninety-two days without a gap, across every transfer between grid, generator and solar that happened in that time.
What is wrong with this
What could still be wrong with this
The share rests on three pulse meters being 400 impulses per kilowatt-hour, which is what the register says and what we have not yet confirmed on the bench. At 1,000 impulses per kilowatt-hour the untraced share is nearer 81% rather than 74%. We would rather print that here than be corrected on it by someone reading this page.
16
What measurement is worth, and what it is not
There is one good Lebanese number on the value of metering by itself. It comes with a category mismatch, and the mismatch belongs next to it.
Figures in this section
9%Generator margin returned to consumers by metering, at 85% loadPublished source
Published source
Source: World Bank, Distributed Power Generation for Lebanon: Market Assessment and Policy Pathways, May 2020 (data year 2018) · As of 31 December 2018
Measured on neighbourhood subscription operators, not on factories with their own gensets — it proves the value of measurement, not a factory's saving.
32%The same margin at 65% loadPublished source
Published source
Source: World Bank, Distributed Power Generation for Lebanon: Market Assessment and Policy Pathways, May 2020 (data year 2018) · As of 31 December 2018
Same category caveat as the 9% figure: subscription operators, not factory gensets.
When Lebanon replaced flat-rate neighbourhood generator billing with metering, the World Bank quantified what happened to the seller: for a 500 kVA operator, profit fell by 9% at an average load of 85% and by 32% at 65%. No efficiency work was done. That margin was consumers paying for energy they had not consumed.
The international evidence is thinner than it looks. Lawrence Berkeley National Laboratory's study of nine US industrial facilities found 74% of savings came from operational, no-cost or low-cost actions, and that three facilities implementing only operational actions averaged 9.2% energy savings. But those numbers are conditioned on a formal energy management system with trained staff, management commitment and third-party audit — not on installing meters. Attributing 9.2% to software is not supported by the source that produced it.
The same study is worth quoting against ourselves: metering and monitoring equipment averaged US$28,000, about 9% of total programme cost, and four of the nine facilities installed none at all. Internal staff time was the dominant cost. Anyone telling you metering is the expensive part of energy management has it backwards.
What is wrong with this
The mismatch, stated plainly
The World Bank finding describes neighbourhood subscription operators, not factories running their own gensets. The Ministry's own data puts subscriptions at 2.1% of the industrial electricity bill against 51.7% own-diesel. The best Lebanese number on the value of measurement is measured on a different customer than yours. It proves the principle. It does not predict your bill.
17
What this evidence does not support
Carried over from the study's own section on unsafe claims. These are things we could say, that would help us, and that break under anyone who checks.
- “There are 18,000 factories in Lebanon.”
- The association representing those factories says on the record that the number is wrong and includes craftsmen who do not qualify for an industrial licence. 5,000 to 6,000 licensed, 400 to 900 at the serviceable tier.
- “This addresses EDL's 40% losses.”
- Those are distribution theft, meter tampering and non-payment on the utility's own network. Nothing installed behind a factory's meter recovers a kilowatt-hour of it. It is the fastest way to lose a technical reader, and we have watched vendors do it.
- “Monitoring saves Lebanese factories X%.”
- No Lebanese study of monitoring-only savings exists. None. All the available evidence is American and explicitly conditioned on a full management system. Until our own before-and-after data exists there is no defensible percentage, so we do not print one — which is also why this site works out what you are paying now and stops there.
- “Lebanon is energy-inefficient.”
- Its primary energy intensity is level with the OECD average, because it barely manufactures. Anyone arguing from the intensity indicator is misreading it. The argument is cost, and only cost.
- “Lebanese industrial power costs three to five times EU rates.”
- No comparator series was obtained. It is a plausible sentence with nothing behind it, so it is not on this site.
- “ISO 50001 delivers 10% savings.”
- The most recent assessment finds 10% is generally an overestimate: 4.5 to 5.0% in chemicals and refining, about 5% in cement, and the author flags selection bias because only successful implementations get written up.
- “We prevent equipment damage from source transitions.”
- There is zero credible quantification of what power-quality events cost Lebanese industry. Every search returned equipment-vendor marketing. It is also the most valuable dataset anyone in this market could produce, which is a reason to go and measure it, not a reason to claim it.
- “EU carbon rules will force factories to measure.”
- The carbon border mechanism binds the EU importer. Lebanon's trade in covered sectors with the EU is roughly US$7.5 million across two destinations, and the Omnibus directive explicitly caps what an EU buyer may demand from a supplier under a thousand employees.
- “You can finance this with a green loan.”
- The national subsidised facility funded 0% of 2021–2023 solar. The EBRD's facility is cancelled. About US$17 million of demand-side efficiency finance reached the whole country in twelve years. Customers pay cash, and pricing that ignores it is pricing for a different country.
- “Energy is 5.7% of a factory's selling price.”
- That figure is from a 2016 bank blog quoting an industrialists' association president — pre-collapse, pre-subsidy-removal, pre-tariff-reset, pre-solar-boom. Presenting it as current would be a material misrepresentation.
18
Where all of this comes from
Every figure above carries its provenance in the disclosure beneath it: whether we measured it, looked it up or computed it, which document it came from, what date it describes, and what is wrong with it. Where a number was derived, the arithmetic is written out rather than summarised.
The primary documents are EDL's Cost Recovery Plan Addendum of December 2025 and its tariff notice 429 of February 2024; the Ministry of Energy and Water's published generator tariff and fuel prices; the Ministry of Industry's Permanent Industrial Statistical System for 2017 and its 2022 licence lists; LCEC's 2023 Solar PV Status Report and the National Renewable Energy Action Plan 2025–2030; the World Bank's Distributed Power Generation for Lebanon of May 2020; the Central Administration of Statistics' national accounts; and Lawrence Berkeley National Laboratory's assessment of the Superior Energy Performance programme.
This page is reviewed quarterly, and the date at the top moves when it is. Lebanese fuel prices move monthly and a page dated 2026 still saying 2026 in 2028 answers the question you are really asking — whether a two-person company will still be here — in exactly the wrong way.
If your own numbers disagree with these
Then yours are the better numbers, and we would like to hear them. Send them to us: if you are right we will publish the correction and say where it came from. We would rather be corrected in public than quoted wrongly in private.
Cite this
sol4.o, "What a kilowatt-hour costs in Lebanon, and how we know". Available at https://sol4o.com/industry-4-0
Figures on this page carry the document and date they came from. If a source we cite has been updated since, the date above tells you how stale we are.